Charts
A tool for Logos 9 
Page Contents
Charts is a grapics tool which can be accessed from Bible Word Study translation ring sections and from the Search tool when using Bible or Morph methods. Within that window you can select from several methods to show your graph results: Bar & Column charts, Pie & Donut charts, Line & Area charts, and some others. These graphs can show you where your search word/phrase was found in the different books of the Bible, as well as give you specific number of times that it was found.
The charts can provide you a wealth of details about the frequency and locations of your search word(s) in books of the Bible. When starting the graph from the Search tool you can also compare how many times your word(s) were found in different translations. If you search for original language words you can also see how many times they are found in different books e.g. a Greek word in New Testament and LXX.
Opening the Charts window
Opening from Bible Word Study
You can open the Charts tool from inside the Translation sections of the BWS.
| BWS mode |
Open the graph from |
| English word |
Hebrew Words section |
| |
Greek Words section |
| Original language word |
Translation section |
| (Greek words only) |
Septuagint Translation section |
In each of these ections of the BWS you will see a small bar graph in the upper right corner:
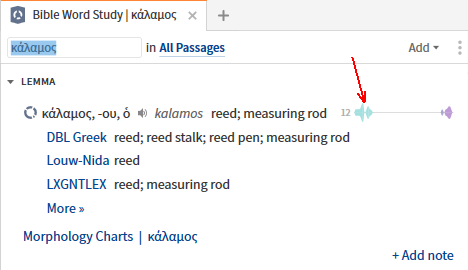
- Simply click on the bar graph and Logos will open a Charts window.
- The Chart will use the Bible that you had selected in BWS.
When you use the Bible or Morph search methods in the Search tool you will see the Charts button:
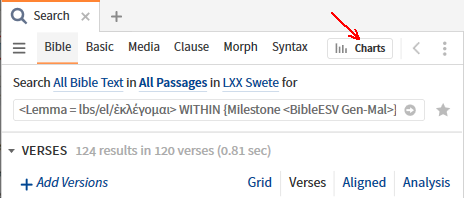
- Simply click on it and Logos will open a Charts window.
- The Chart will use the Bible(s) that you had selected in your Search.
Chart Controls
- To select a graph method simply click on one of the options in the Sidebar.
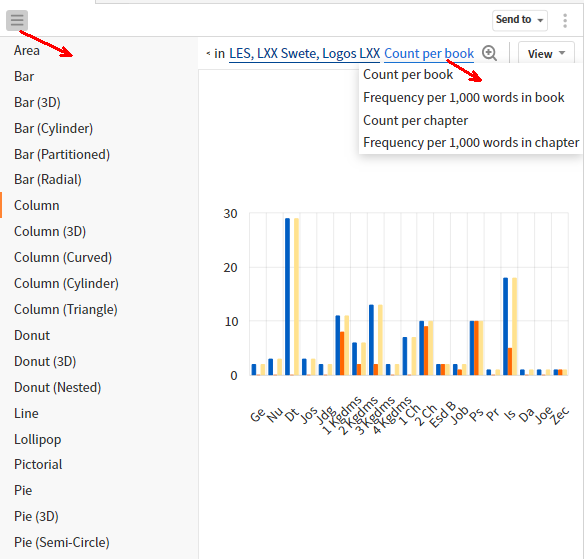
- only the main variants are described in this wiki.
- Click on the graph’s method in the toolbar to change the kind of statistics that are shown e.g. Count per book.
- The View menu gives you options for the appearance and scale of the chart:
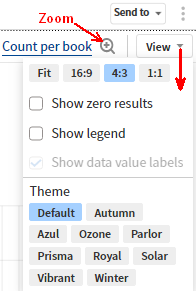
- Click on Show zero results to view Bible books/chapters that have no hits in them.
Be aware that this could slow the response of the chart to other controls. - Show legend will show you the color assigned to a bar or line for each bible in the chart.
- The Zoom button will allow you to scale the chart for better viewing of crowded details (follow its tool tip).
- When Zoom is selected, you can point the mouse at any part of the chart and see popups of the axis values
e.g. Jn 13, 20 (not hits unless the mouse is pointed correctly).
The Bar and Column Charts
The Bar and Column charts are very similar with the difference being one shows horizontal bars and the other shows vertical bars (Column).
Be sure to view in a floating window without the sidebar so that the axis labels will be visible, else you will have to Zoom the chart.
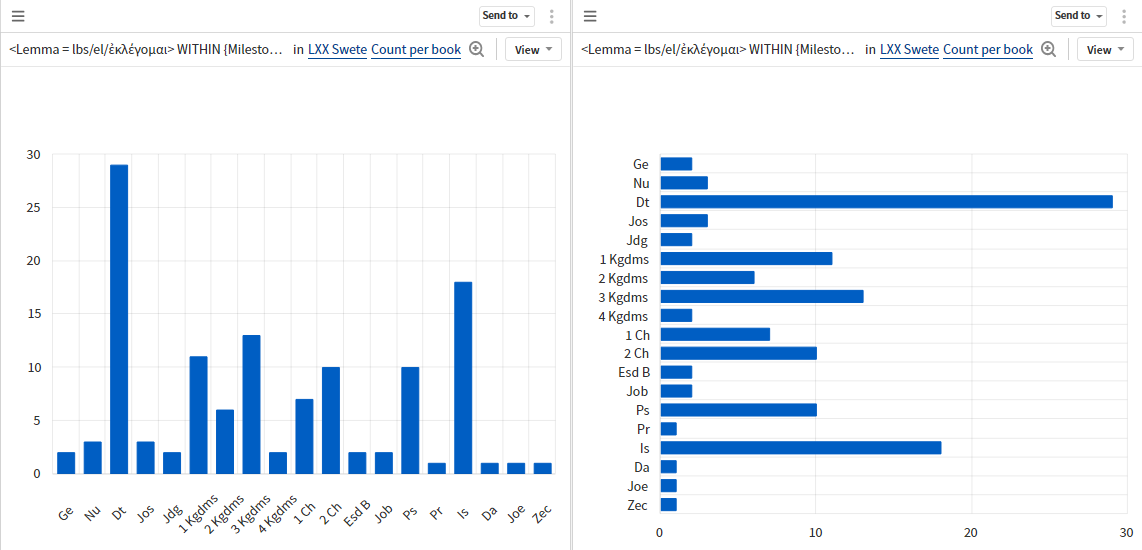
If you have searched multiple Bibles, then you can click on the Bibles in the toolbar to select/deselect bibles that are shown as separate bars.
The View menu will allow you switch on a legend that will identify the bar color of each bible.
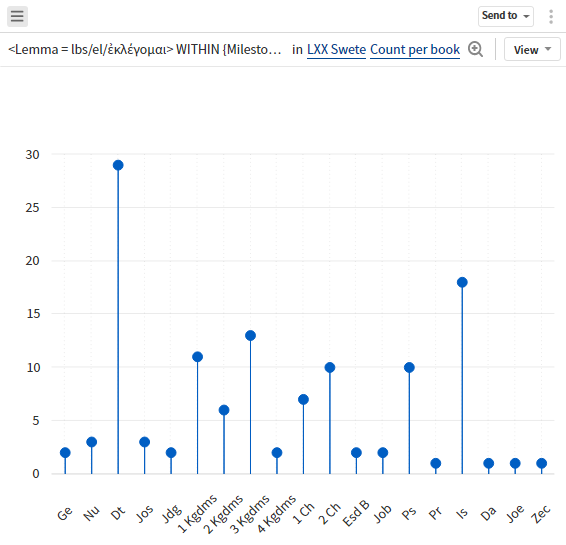
Lollipop
This is a pictorial variation of the Column chart.
The Pie and Donut Charts
The Pie and Donut charts show you all the hits as they are found in a single Bible. As you can see, they are very similar.
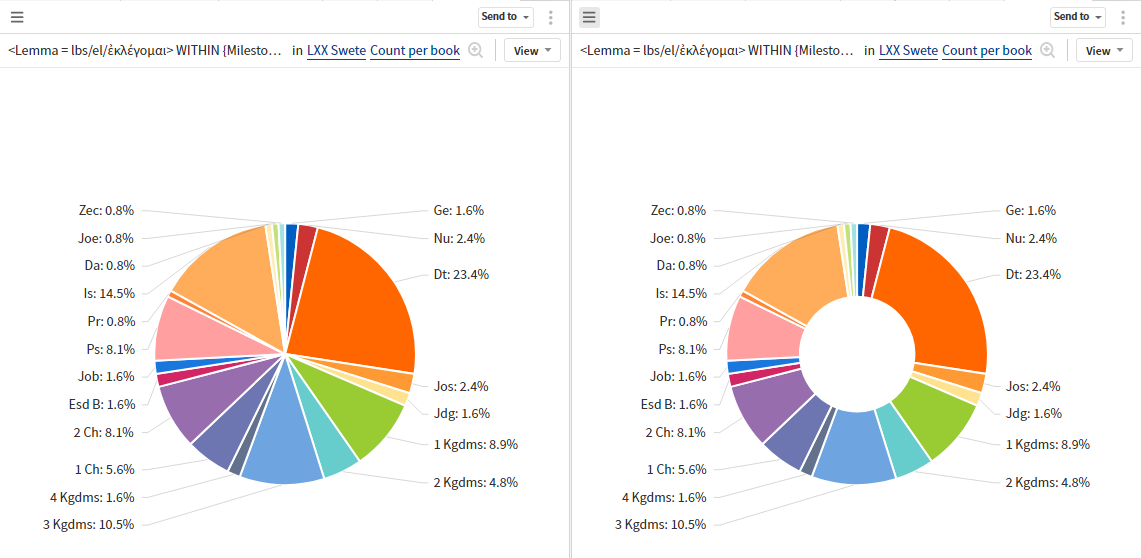
If you have searched multiple Bibles, then you can click on the Bible in the toolbar to select another Bible for the chart.
If you hover your mouse over a slice in the chart you will see a pop-up box identifying the Bible book, the number of hits
and their percentage of the total.
The Line and Area Charts
The lines connect the dots of the vertical axis value.
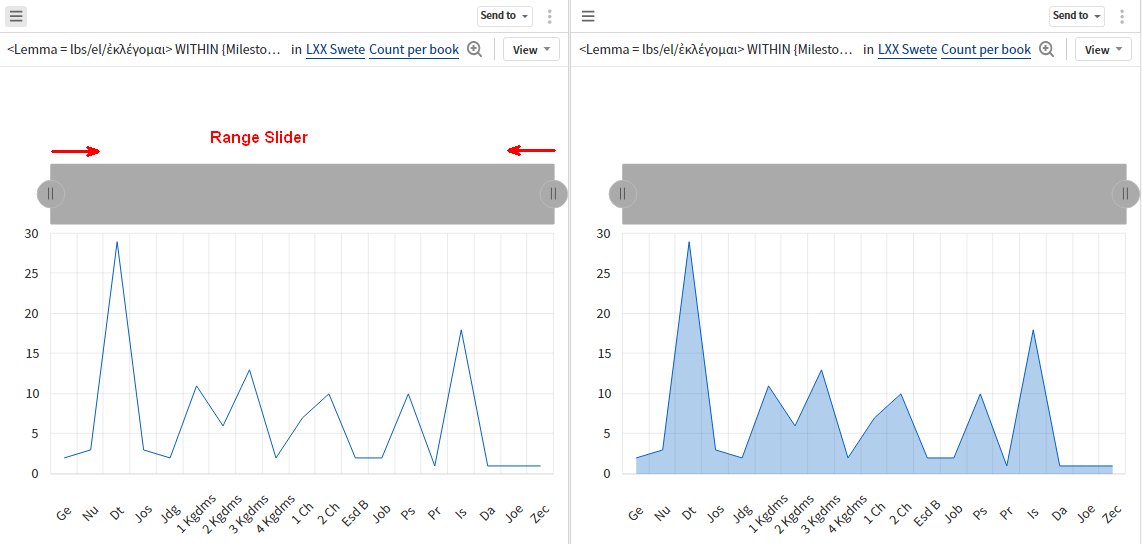
Note the large range slider. This enables you to zoom the chart to better view all the axis labels (bible books).
If you have searched multiple Bibles, then you can click on the Bibles in the toolbar to select/deselect bibles that are shown as separate lines.
The View menu will allow you switch on a legend that will identify the line color of each bible.
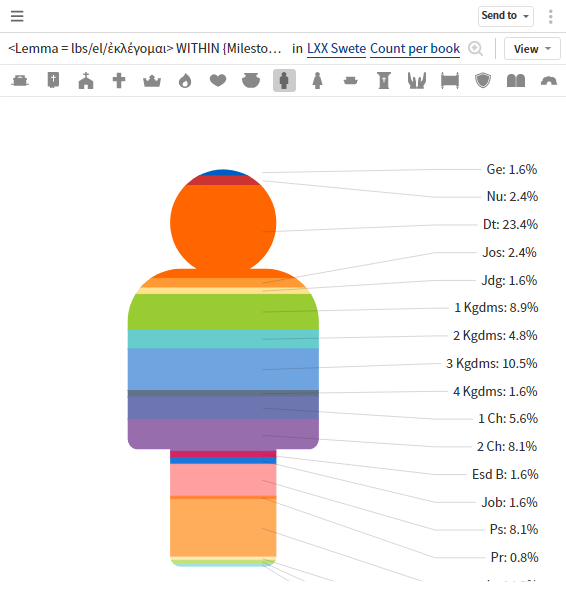
The Pictorial Chart
This is a fun chart. You can choose from several pictures, but you need to hover over them to get information.
Printing/Exporting the Graphs
You can print/export your graph by opening the Send to menu in the toolbar:
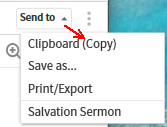
- Clipboard.. will allow you to paste the chart in another document.
- Save as... will open a window so you can save it as a graphics file e.g. PNG, JPEG, GIF.
- Salvation is the current/last used Sermon document.
- Print/Export will open a special Print window:
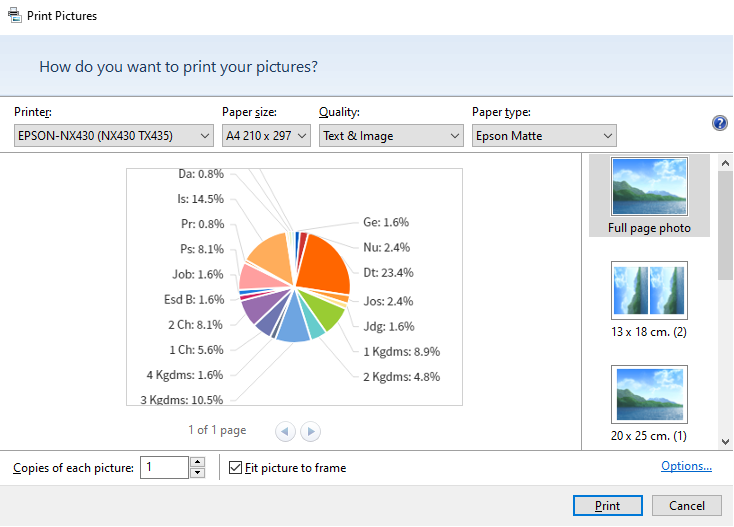
- Click on Options... to see more print settings, including Print Properties.